
Social network
The study of social networking is the study of how the individuals in a group relate to each other. There are multiple ways in which such a connection can be established. For example, an organizational chart defines a clear relationship structure among people working in the organization. Similarly, an emails sent from one person to another creates a connection between them. It is hypothesized that such a connection strongly corresponds to the existing relationships such as work or leisure and therefore presents an important information about the individuals and the organization as a whole.
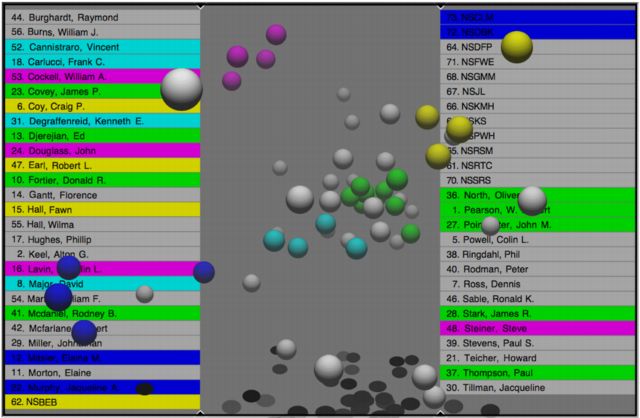
This Figure shows a 3-dimensional presentation of the social network in the White House email collection. The two columns on the left and on the right sides of the picture contain the names (or email addresses if the name can not be determined) of people whose emails were recorded in the collection. The spheres corresponding to these people form a structure between the two columns.
We define the strength of such a connection by the number of times the two people appear on the same email message (a person appears on a message if he either sends of receives the message). We view this connection strength as a measure of closeness or similarity between two people. eArchivarius visualizes the inter-person similarity by representing each person as a sphere and positioning the spheres in 2-or 3-dimensional space in proportion to the inter-person similarity. Thus, if two people are strongly connected, i.e., they exchange a lot of emails, the corresponding spheres will be very close and if the spheres are far a part, the people never write to each other or receive email from the same person. This presentation builds heavily on the Lighthouse system developed and extensively studied for visualizing documents retrieved by a search engine
The visualization can be described as a tight cluster of spheres at the center of the structure with additional small clusters that positioned on the periphery. Those small clusters are separate from each but they are all linked to the center group. We used green color to mark that center group of spheres. The corresponding names are also highlighted in green. Those are the people at the center of the email conversations in this collection – everybody in the collection corresponds with those people
If we double-click on one of the names in the social network visualization, eArchivarius will show the information page about that participant in the email collection.
